
This study conducted by the TheaterSeatStore team explores the cities with the best and worst access to the Internet.
top 25 worst-connected cities
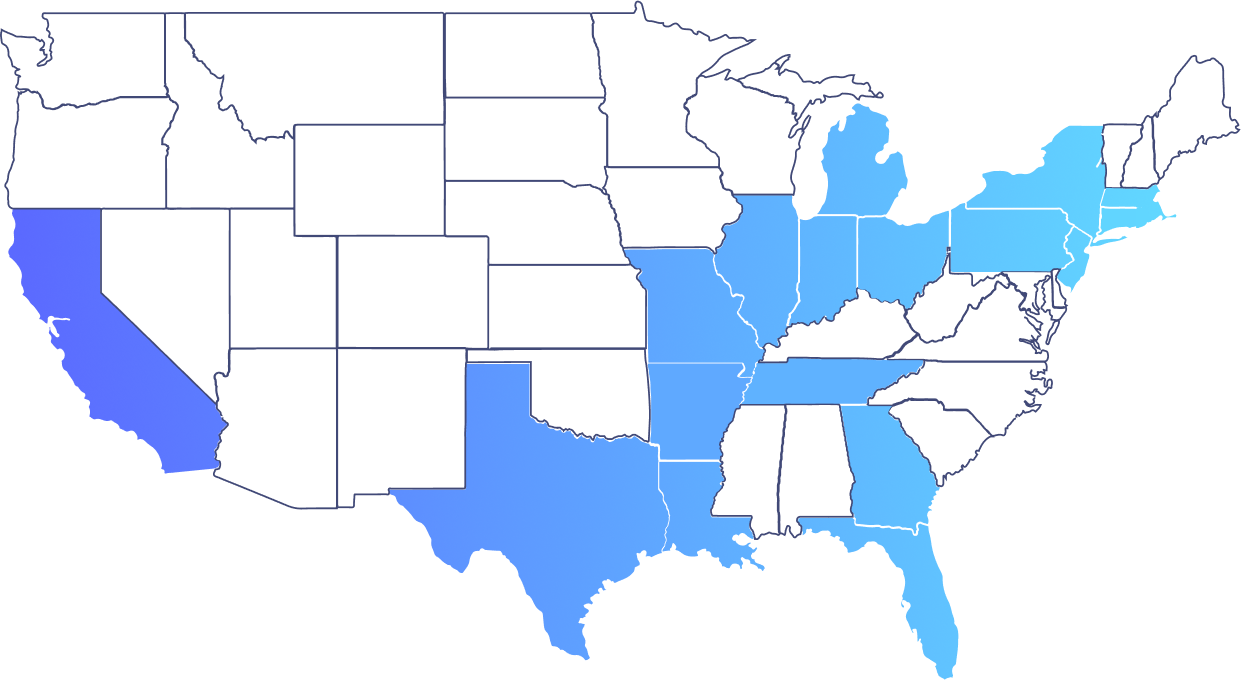
Here are the top 25 U.S. cities with the highest percentage of households without Internet access (or worst-connected cities):
-
Total households without internet access
-
Total households with internet access
NO.
CITY & STATE
% of households without Internet
01
Harlingen, Texas
30.20%
6,911
15,990
02
Gary, Indiana
29.30%
8,635
20,831
03
Pharr, Texas
28.50%
6,583
16,543
04
Cleveland, Ohio
27.30%
46,890
1,24,742
05
Miami, Florida
25.60%
48,408
1,40,676
06
Shreveport, Lousiana
25.50%
18,655
54,459
07
Flint, Michigan
24.70%
9,912
30,209
08
East Los Angeles, California
24.70%
7,579
23,097
09
Bossier City, Louisiana
24.70%
6,602
20,075
10
Decatur, Illinois
24.50%
7,281
22,491
11
Albany, Georgia
24.10%
6,185
19,455
12
Lawrence, Massachusetts
23.90%
6,644
21,200
13
Newark, New Jersey
23.70%
24,250
77,905
14
Trenton, New Jersey
23.70%
6,688
21,558
15
Camden, New Jersey
23.50%
5,655
18,396
16
Lynwood, California
23.10%
3,493
11,649
17
Hialeah, Florida
22.90%
17,385
58,604
18
Memphis, Tennessee
22.80%
58,106
196,317
19
Reading, Pennsylvania
21.60%
6,331
22,994
20
Mount Vernon, New York
21.10%
5,611
20,924
21
St.Joseph, Missouri
21.00%
6,174
23,225
22
Waterbury, Connecticut
20.80%
8,739
33,374
23
New Rochelle, New York
20.70%
6,660
25,591
24
Fort Smith, Arkansas
20.50%
7,408
28,802
25
Fall River, Massachusetts
20.30%
7,676
30,223
top 25 MOST-connected cities
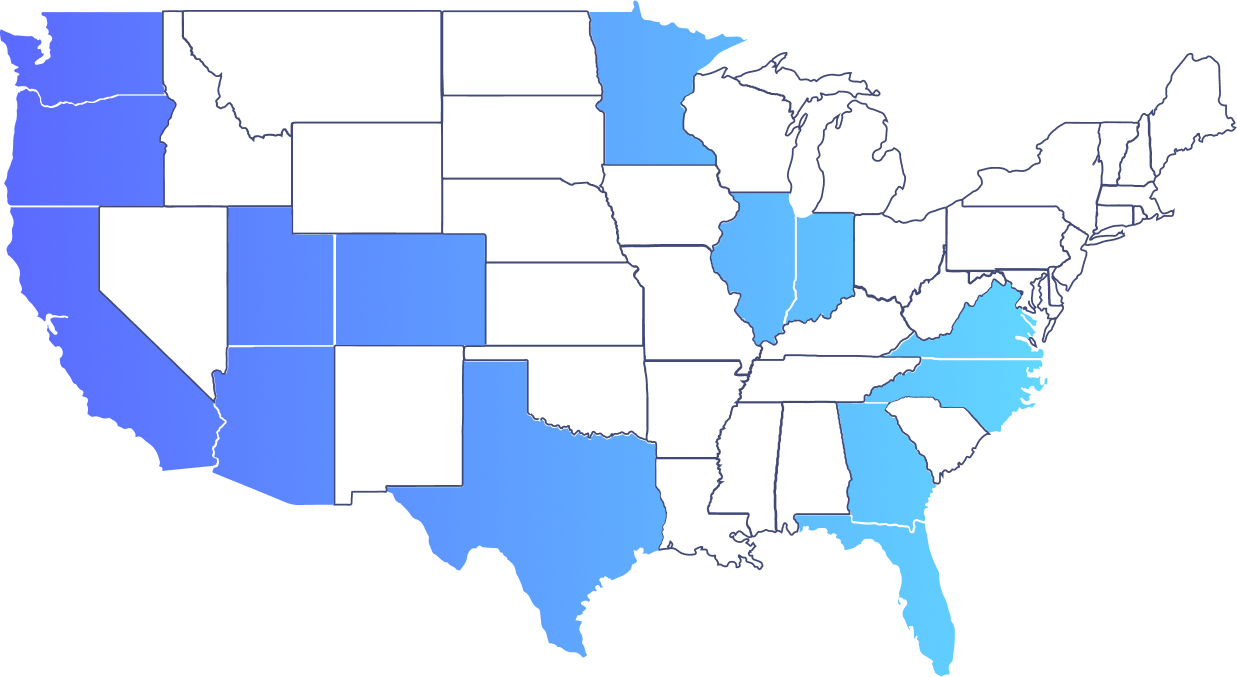
Here are the top 25 U.S. cities with the lowest percentage of households without Internet access (or cities with the most households having Internet access):
-
Total households without internet access
-
Total households with internet access
NO.
CITY & STATE
% of households without Internet
01
Johns Creek, Georgia
100%
0
28,638
02
South Jordan, Utah
99.20%
171
20,371
03
Flower Mound, Texas
99.20%
230
26,969
04
Fishers, Indiana
99.00%
336
34,510
05
Naperville, Illinois
99.00%
507
51,731
06
Bellevue, Washington
99.00%
606
58,710
07
Chino Hills, California
98.70%
357
26,499
08
Wesley Chapel, Florida
98.50%
319
20,266
09
Centreville, Virginia
98.50%
356
2,29,932
10
San Ramon, California
98.40%
420
25,277
11
Centennial, Colorado
98.40%
649
39,502
12
The Hammocks, Florida
98.30%
329
19,288
13
Maple Grove, Minnesota
98.30%
480
28,103
14
Hillsboro, Oregon
98.30%
657
37,428
15
Cary, North Carolina
98.30%
1,072
63,656
16
San Clemente, California
98.20%
406
22,776
17
Yorba Linda, California
98.20%
410
22,266
18
Redmond, Washington
98.20%
531
29,350
19
Pleasanton, California
98.20%
531
28,463
20
Highlands Ranch, Colorado
98.20%
652
36,429
21
College Station, Texas
98.20%
732
39,549
22
League City, Texas
98.20%
684
38,226
23
Gilbert, Arizona
98.10%
1,508
79,727
24
Lehi, Utah
98.00%
368
18,043
25
Redondo Beach, California
97.90%
545
25,815
top 10 MOST-Populated cities
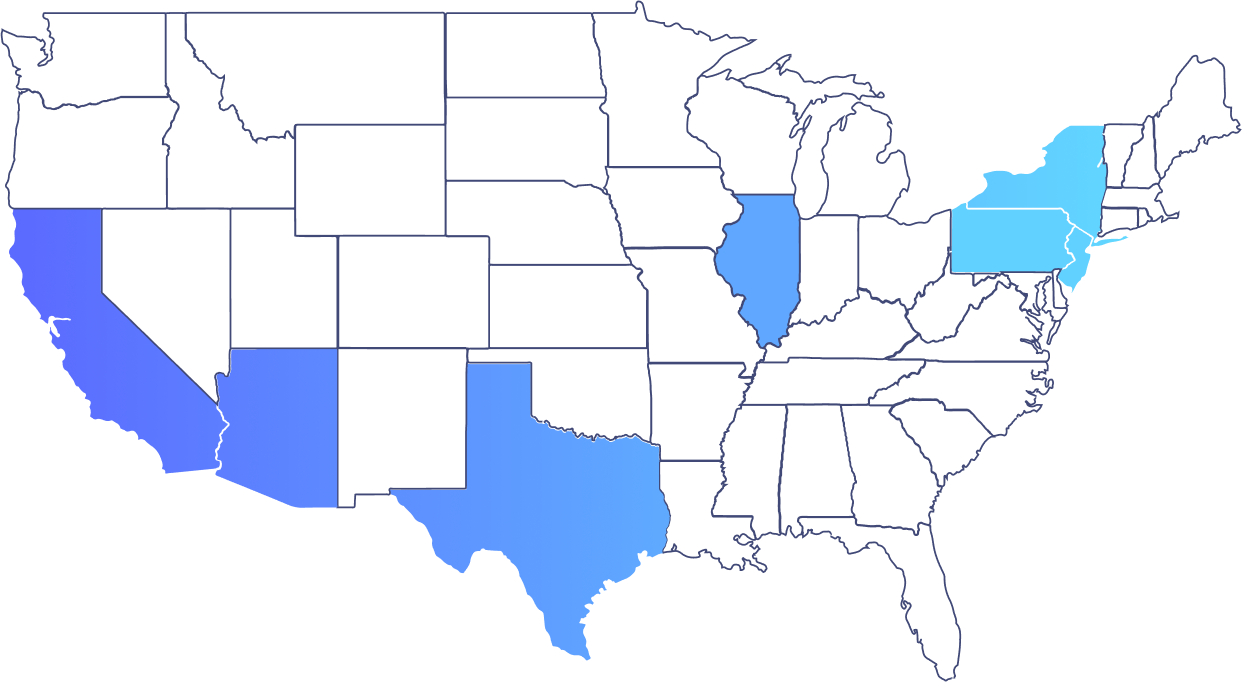
How do major U.S. cities with the highest populations compare? Here are the top ten major U.S. cities with the highest percentages of households without Internet access:
-
Total households without internet access
-
Total households with internet access
NO.
CITY & STATE
% of households without Internet
01
Dallas, Texas
14.10%
73,377
4,45,621
02
Chicago, Illinois
13.10%
1,41,260
9,39,085
03
Philadelphia, Pennsylvania
13.00%
80,799
5,38,706
04
Houston, Texas
12.90%
1,13,110
7,63,394
05
New York, New York
12.60%
4,03,380
28,07,653
06
San Antonio, Texas
12.60%
64,314
4,47,959
07
Phoenix, Arizona
11.60%
68,193
5,18,685
08
Los Angeles, California
09.60%
12,64,029
1,34,871
09
Austin, Texas
08.10%
3,76,838
33,065
10
San Diego, California
05.60%
28,740
4,83,790
While there are no known U.S. cities with no Internet access at all, this infographic creates a fascinating snapshot of the worst-connected cities.
This data can help raise awareness toward creating a more accessible Internet infrastructure in the United States.
This data can help raise awareness toward creating a more accessible Internet infrastructure in the United States so more people can perform essential tasks such as working from home, applying for jobs, attending school, accessing information, enjoying entertainment such as streaming movies and television shows, playing video games, and staying connected to family and friends.
- Two Seater Theater Chairs
- Heated Movie Theater Seats
- Brown Leather Theater Chairs
- Skinny Theater Chairs
- Luxury Reclining Chairs
- Theater Leather Seating
- Theatre Couch Furniture
- Theatre Chairs Outlet
- Recliner 400 Lbs
- Spacing For Theater Seating
- Top Brand For Theater Seating
- Home Theater Sofa Sectional
- Best 2 Person Recliner
- 3 Seat Chairs
- Couch Sofa Set
- Home Movie Theater Seats For Sale
- Theater Chair Accessories
- How Much Is A Movie Room
- Headrest Pillow For Recliner
- Single Row Home Theater
- Comfy Movie Chairs
- Reclining Sofa With Built In Table
- Rugs For Movie Room
- Carpet For Theater Room
- Recliner With Outlets
- Diamond Stitch Leather
- Lights Under Couch
- Motion Sofa Diamond Tufting Leather
- Cinema Seats Manufacturers
- Massage Sofas On Sale
- Brown Leather L Shaped Sofa
- Home Theater Sectional Sofas
- Best Price Home Theater Seating
- Cinema Furniture Store
- Best Chairs For A Home Theater
- Against The Wall Recliners
- Home Theater Seating Colorado
- Movie Theater Recliner Outlet
- 4 Seater Theater Seats
- Connected Curved Recliners
- Theater Reclining Sofa
- Best Home Theater Sectionals
- Best Theater Chair
- Lounge Seat Theater
- Interior Design Industries
- Auditorium Seating Manufacturers
- High Back Leather Recliner
- Extra Big Couches