Every week throughout the Broadway season, The Broadway League collects audience data from theater owners. These are used to compile an annual report which gives a fascinating insight into the character of the Broadway audience and any developing trends.
This article summarises the highlights of the 2018/19 report.
Broadway welcomes a record 14.8 M people in 2018/19

Back in the 1996/97 season, broadway audiences surpassed the 10 million mark for the first time. In the 2014/15 season, the numbers surged past 13 million. In 2018/19, Broadway broke the admissions record again with 14.8 million people enjoying its world famous plays and musicals.
But who are those theater lovers? Where do they come from? How old are they? Are they male or female? How much do they earn? Have they been to grad school? Is the audience diverse?
We pored over the charts and stats to answer these questions and more.
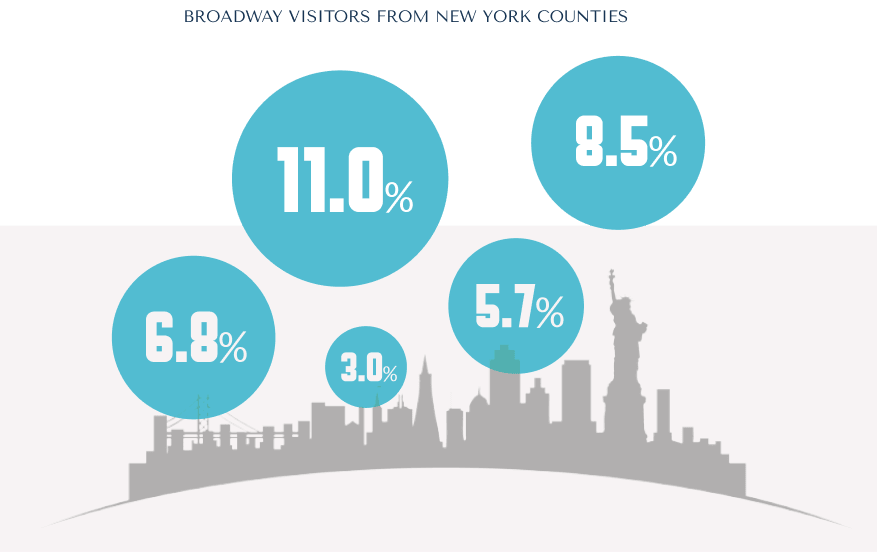
A fifth of Broadway visitors come from
New York city Itself
The 2017/18 report found that 35% of Broadway theatregoers hailed from the New York City Metropolitan Area. This figure includes 20% from New York City itself and 16% from the suburbs.
Breaking it down by county, 11.0% of Broadway attendees were from Manhattan, 8.5% were from one of the other NYC boroughs and 5.7% were from Long Island. 3.0% of audience members hailed from Westchester or Rockland County while 6.8% lived in one of the north New Jersey counties (Bergen, Essex, Hudson, Middlesex, Morris, Passaic, Somerset or Union).
Tourist continue to flock to New York and Broadway
2017/18 Tourist VISIT data of New York and Broadway

This means that tourists make up the biggest proportion of the Broadway audience at 65%.
Since the crash of 2018, the tourist industry in New York City has been showing a healthy year-on-year rise and this has been reflected in a similar increase in Broadway attendances by non-NYC natives.
2018/19 saw 6.81 million US tourists and 2.79 million international tourists turn up to shows, making up 46% and 19% of total attendances respectively. In fact, this was the highest number of international tourists ever recorded.
Zip code figures from Broadway ticket sales have revealed that 7 of the ‘Top 20’ counties represented come from outside of the NYC metropolitan area.
These areas are Broward, FL; Fairfield, CT; Los Angeles, CA; Mercer, NJ; Miami-Dade, FL; Monmouth, NJ and Montgomery, PA.


Non-UK Europeans were the largest international group (4.2% of admissions), followed by visitors from Central and South America (3.6%), Canada (3.1%); Asia, India and the Middle East (also 3.1%); the UK (2.9%); Australia and New Zealand (1.7%) and Africa (0.3%).
Comparing the results of The Broadway League’s survey with data from online and telephone ticket sales highlights an interesting discrepancy with people from the New York suburbs buying 20% of tickets and domestic visitors 52%.
This is largely because ticket sales stats record the purchaser of the tickets whereas the surveys were filled in by those actually attending performances. International buyers also tend to favor buying at a box office, where geographical data is rarely recorded.

Two thirds of all Broadway attendees are FEMALE

For decades, females have outnumbered males in the Broadway audience and 2018/19 was no exception with 68% of all tickets going to the girls. This proportion equals the record set in the 2013/14 and 2014/15 seasons. For reference, the number of females in the US population as a whole is 51% which means that males are under-represented in theaters.
For the second time ever, the 2018/19 survey included an 'other' option for gender to ensure inclusion of those people who identified as neither male nor female. 0.5% of respondents selected this option.
Converting those percentages into people gives us 10 million females, 4.6 million males and 70,000 non-binary.
The average female Broadway attendee is a 42.7 years old caucasion with a college degree who attends around 5 shows per year.

Children and teens flock to Broadway

Record numbers of children and teens made an appearance in the 2017/18 season and while 2018/19 saw a drop in those figures, the number of 18-24 year old theatergoers was still the second highest in history. Under 18s accounted for 12.0% of audiences which converts to a head count of 1.8 million.
Children are particularly fond of musicals, forming the fourth most populous cohort at 13.1%. Plays are far less appealing with under 18s making up just 6.6% of the crowd. Of course, age restricted content has a big influence on these figures.
Overall, the 50 to 64 years age bucket contained the largest proportion of Broadway viewers at 23.6% (3.49 million). 19.8% (2.92 million) were in the 35 to 49 years age group; 17% (2.63 million) were between 25 and 34 years old; 15.6% (2.30 million) were over 65 and the smallest cohort was the 18 to 24 year olds at 11.2% (1.65 million).

The average age of a Broadway audience member is 42.3 years

This year’s Broadway League figures shaw a sharp correction in the average age of moviegoers towards an older audience. Following three consecutive years of reduction, the average age of an audience member in 2017/18 had reduced to 40.6 years, the youngest since 2000. 2018/19 however saw this figure jump back up to over 42 years.
Breaking these stats down by place of residence reveals that international tourists are the youngest group with an average age of 36.8 years. Those living in the suburbs of New York were the oldest cohort, averaging 45.3 years.
Attendees from New York City were 40.2 years old on average with the typical US tourist 44.3 years old.
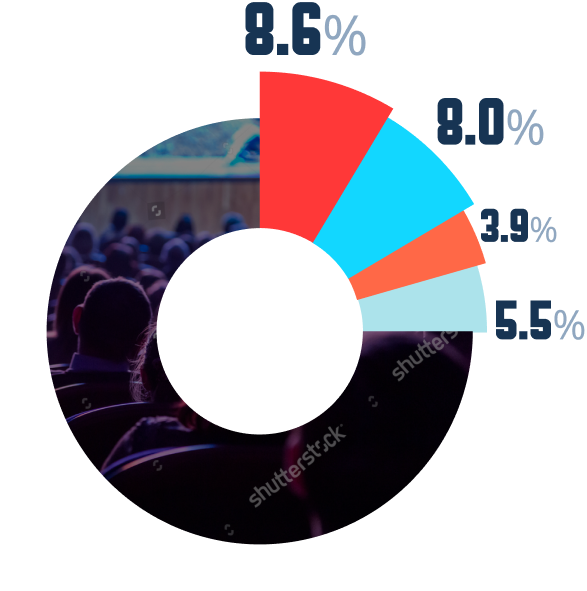
Asian and Hispanic appeal swells audience diversity
There is a trend of increasing diversity within the Broadway audience, largely driven by Asian and Hispanic attendees. The non-Caucasion segment is now just over a quarter with Asians making up the second largest ethnic group at 8.6% (1.27 million people). The proportion of Hispanics fell from 2017/18 but there were still a record number of Hispanic audience members making up 8.0% of the average audience (1.17 million). The 570,000 black audience members made up the smallest ethnic group (3.9%) while all other ethnic groups (including people of mixed race) added up to 5.5% (820,000 people).
Comparing these diversity figures with the United States as a whole reveals that the Hispanic and black communities, which make up 18.0% and 12.3% of the US population respectively, are under-represented in Broadway. Conversely, Caucasions (61.0%) and Asians (5.7%) are over-represented.
Data of Audience diversity in Broadway
Broadway attracts smart college graduates (and they really like plays)

When it comes to educational achievement, the figures are clear: Broadway shows, especially plays, particularly appeal to intelligent consumers. Out of all theatregoers aged 25 or above, an impressive 81% had achieved a college degree (with a further 5% holding a vocational degree). As a comparison, only a third of Americans in the general population have successfully completed college. 47% of Broadway attendees had gone on to earn a graduate degree compared with just 13% of the US population.
Splitting the stats between show type illustrates that plays tend to attract the most educated audiences, with 90% of attendees having a college degree and 51% completing grad school. In contrast, 80% of musical attendees have achieved a college degree and 39% have gone through grad school.
In terms of geographical location, New York City residents were the most highly educated segment with 87% in receipt of a college degree.
Most Broadway viewers take home over 250,000 Dollar a year
Given the educational prowess of the Broadway audience, it should come as no surprise that attendees also tend to be relatively affluent – and are getting wealthier. The average annual household income of a Broadway audience member in 2018/19 was $261,200 as compared to $222,120 in 2017/18. Those hailing from the suburbs of New York were the wealthiest of all with an average household income of $299,259 while those attending plays reportedly earned more than $30,000 more than those who preferred musicals ($288,260 against $255,626).
The average annual household income of
BROADWAY audience in 2018/19


By segmenting the earnings data into income brackets, it can be seen that the biggest proportion of audience members earn between $150,000 and $250,000 (20.1%). 18.7% earned between $100,000 and $150,000; 11.2% took home between $75,000 and $100,000 and 11.0% were in the $50,000 to $75,000 range.
Only 7.0% of theatregoers were on less than $25,000 per year compared with nearly a quarter of the US population. At the other end of the scale, 4% of audience members were raking in $1 million or more annually.
Typical Broadway theatregoers are taking in 4.4 shows A Year
The average Broadway theatregoer will take in 4.4 shows each year. That number increases to 7.5 for those living in the New York City Metropolitan Area and goes down to around 3 for tourists (4 per year for US residents and 2 per year for foreign nationals).
Looking at the figures by show type reveals that playgoers were more enthusiastic than musical attendees, taking in an average of 7 plays a year. In contrast, the most committed musical fans only went to one every quarter.
Once a month isn’t enough for some devoted fans though. 4.7% of the Broadway audience attend 15 or more shows a year. In 2018/19 that broke down to 163,859 people sharing an estimated 4.1 million admissions (that’s 28% of all tickets sold).

More comparisons between playgoers
AND Musical Attendees

Depending on whether there is a play or musical showing, the audience is likely to be very different. A combination of New York residents and US tourists will normally make up the largest proportion of the audience at a play with an average representation of 75%. International tourists are likely to make up just 8.0% of the audience.
However, if you visit a musical, you can expect to see a large contingent of international tourists (over one fifth) with only around 64% of the auditorium containing New York residents and US tourists.
Plays also attract an older, wealthier and more highly educated audience member. The average profile of someone attending a play is 47 year old college graduate with a household income of over $280,000 per year.
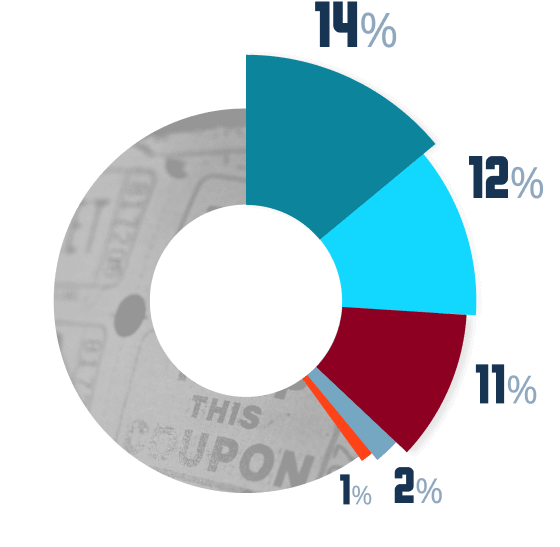
Ticketmaster and Telecharge are the most popular ticket outlets
When it comes to getting hold of their Broadway tickets, 6 out of 10 people prefer to book online. Most choose either Ticketmaster, the general ticket specialists, or Telecharge, the official site for booking Broadway shows.
12% of theatregoers like to visit the box office personally while 11% take advantage of the savings available through the four TKTS discount booths in New York. While Americans are most likely to book online, foreign visitors are more likely to purchase their tickets at the box office or a TKTS booth.
Just 2% of audience members now book over the phone while 1% subscribe to not-for-profit ticket schemes. The remaining 14% of attendees obtain tickets from a range of other sources including brokers, hotel concierges and group booking sites.
Theatregoers
are a sociable bunch

The majority of theatre fans, particularly females, prefer to take a partner or a few good friends with them rather than going alone or in big groups.
49% of men generally attended with a spouse or partner but the same was true of only 33% of women. Around a fifth of seniors took a female friend with them while children, not surprisingly, tended to go with parents.
Google is now the number one way to get info on Broadway shows
When looking for information about an upcoming Broadway show, Google is the online destination of choice although only 37% respondents gave that answer in 2018/19 compared to 46% in 2017/18. Google was the search platform of choice across all ages except the over 65s with theatregoers aged 18-34 (44%) most likely to use it. Seniors prefer to use Ticketmaster.com (23%) over Google (22%) as do those living in the suburbs of New York (38% over 28%)
Ticketmaster.com (29%) overtook Broadway.com (28%) as the second most visited source of information.
Other online sources recorded in the survey were Playbill.com, Telecharge.com, Broadway.org, BroadwayBox.com, Theatermania.com, BroadwayWorld.com, IDBD.com, Show Score and general travel websites.
The New York Times was the most popular print source of show information, read by 20.4% of audience members while Instagram and Facebook were both equally popular, consulted by 12% of visitors. Falling behind as information sources were TV (8.8%), Twitter (5.4%) and Radio (5.2%).
The power of social proof
Social psychologists have found that humans generally tend to follow the herd when it comes to buying products or trying new things. They find ‘social proof’ via word of mouth, testimonials and reviews and going to see a play or musical is no exception.
The Broadway League survey found that before deciding on a show, 22% elicit personal recommendations through word of mouth.

Broadway looking to build on childhood connections
One interesting finding that the Broadway League picked up on was that a significant majority of theatregoers they surveyed had first experienced Broadway as children.
To maintain and strengthen this connection, various youth and school programs have been set up. These include Broadway Bridges®, Kids Night on Broadway® and The Jimmy Awards®.
Broadway Bridges offers tickets at $10 apiece to tenth grade students of New York City public (DOE) high schools and their chaperones. The affordable tickets are available on select weeknight performances and matinees from October to April. Full-time teachers and school admins are eligible to make group bookings.
Kids Night on Broadway (KNOB) allows children free entry to performances if they are accompanied by a full paying adult. The program also includes discounts on food and parking.
The Jimmys (also known as the National High School Musical Theatre Awards®) are awarded to students demonstrating outstanding achievement in vocals, dance and acting. They are presented by The Broadway League Foundation.
By keeping the conveyer belt of movie-lovers well greased, there is no reason to doubt that the upward trend in Broadway attendances won’t continue for generations to come.