
Producers and directors in the United States can look forward to over 159,000 jobs available across the country, and many more are opening virtually every day as more shows are created and approved. Plus, studies have revealed that this job provides a median salary of $76,400, making it one of the most lucrative positions to hold within the world of the arts.
Median Pay,
2020
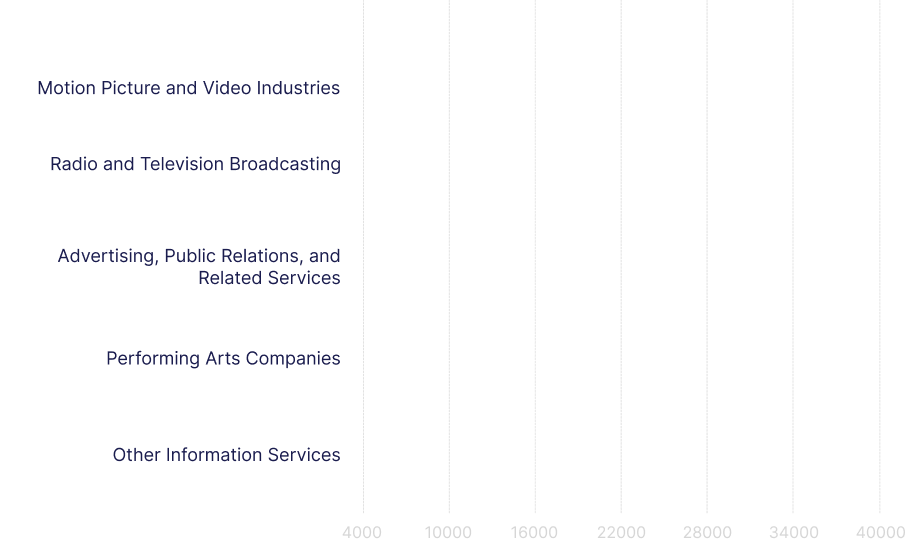
Number of Jobs,
2019
Job Outlook,
2019-29
Employment Change,
2019-29
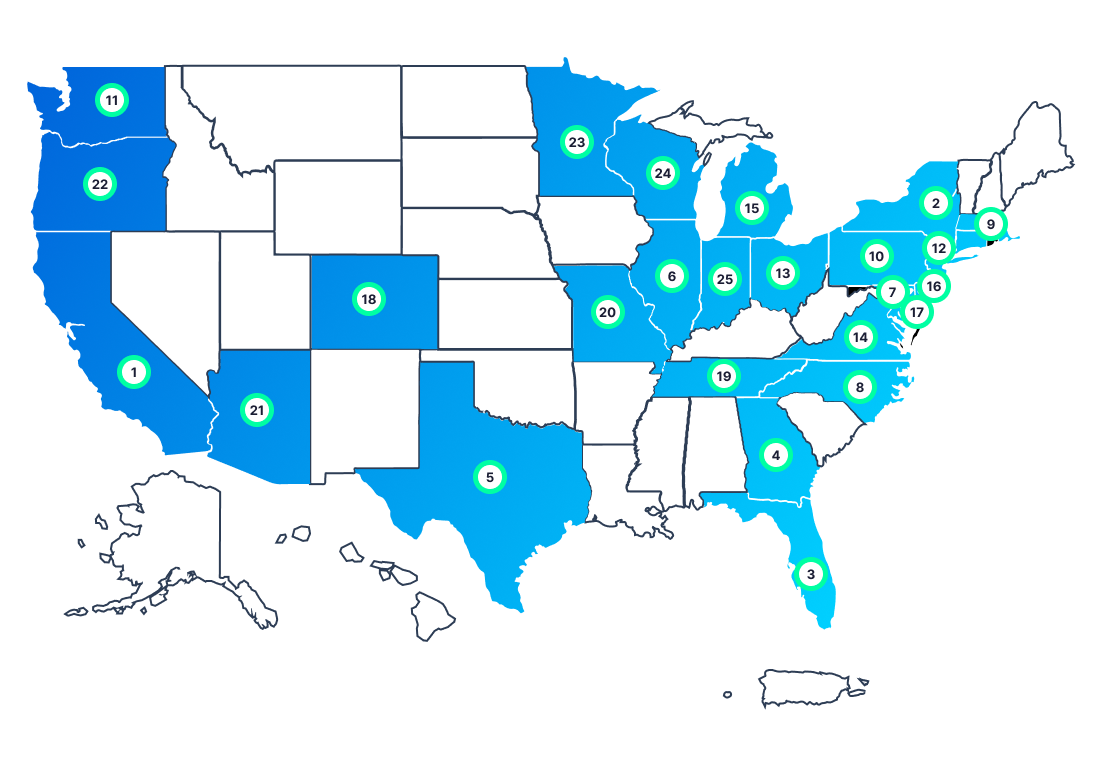
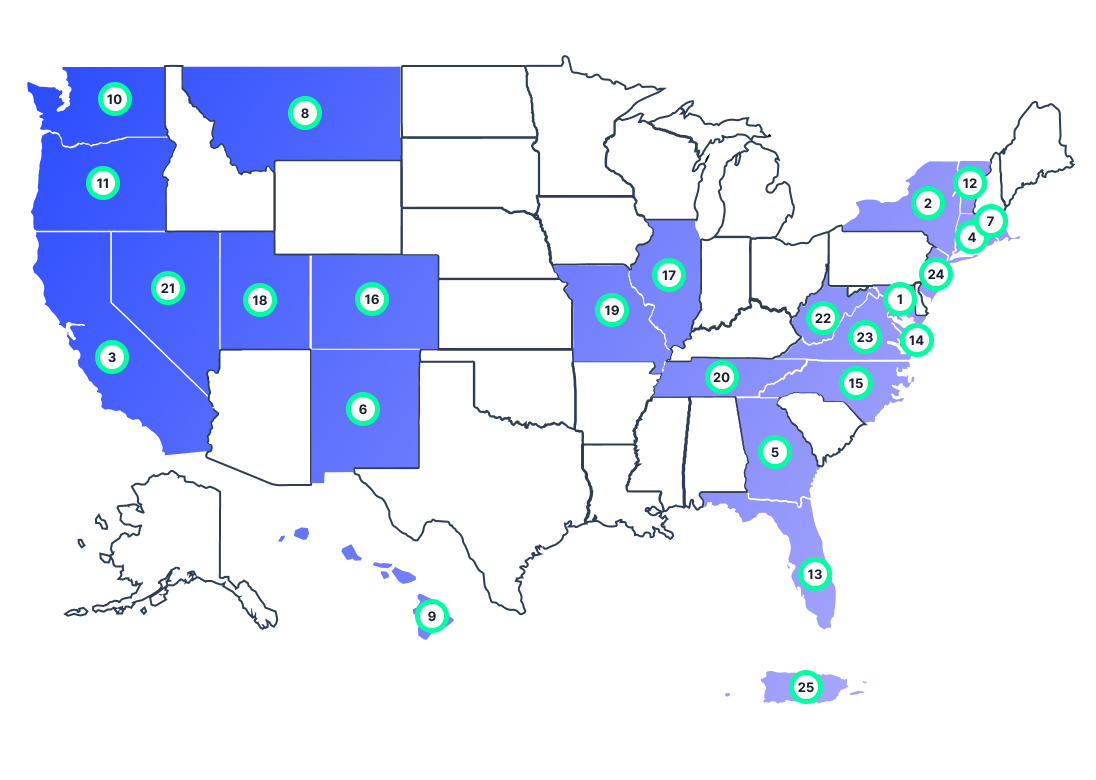
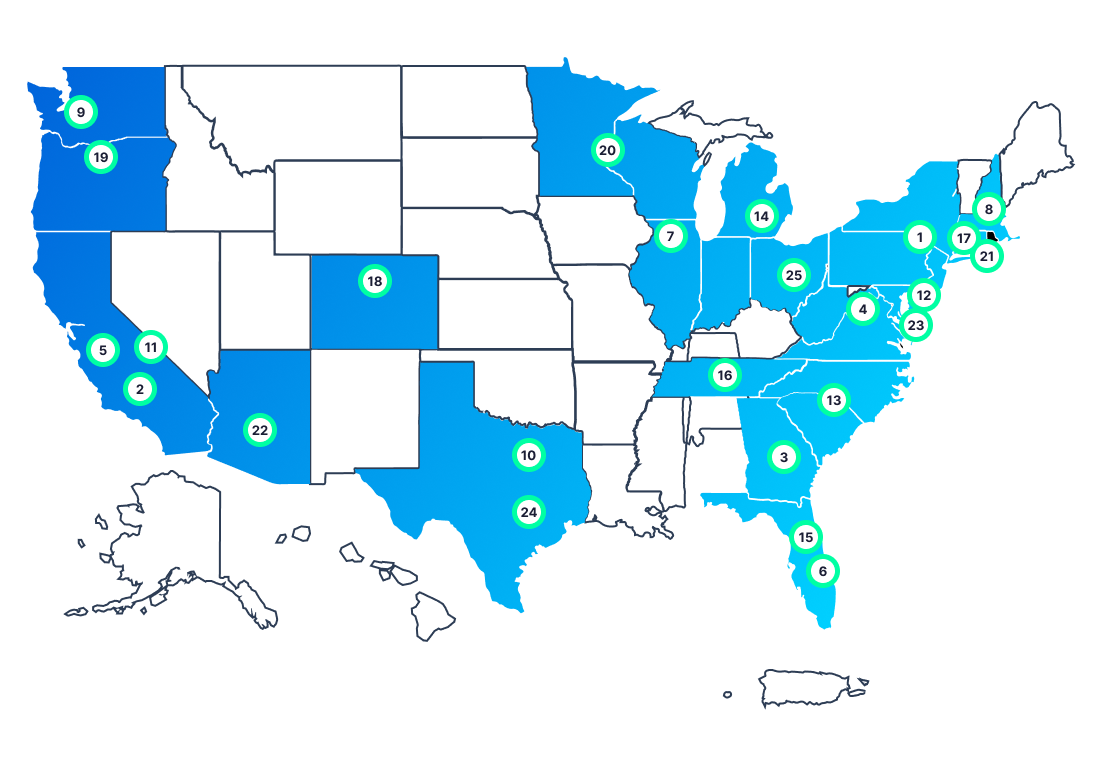
Top 25
Best States For
Producers
and Directors
While people in every state tend to view movies, TV shows, and other productions, some areas consume this media more and thus create more demand within the field for producers and directors, including Indiana, Wisconsin, and Minnesota.
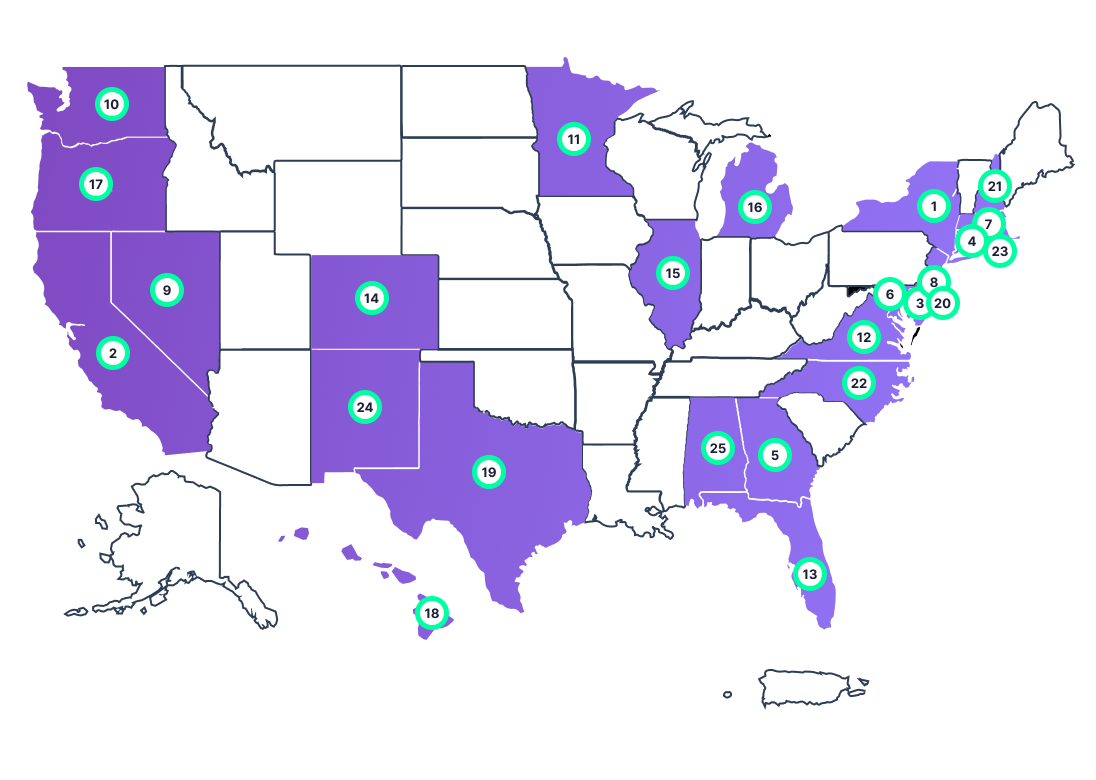
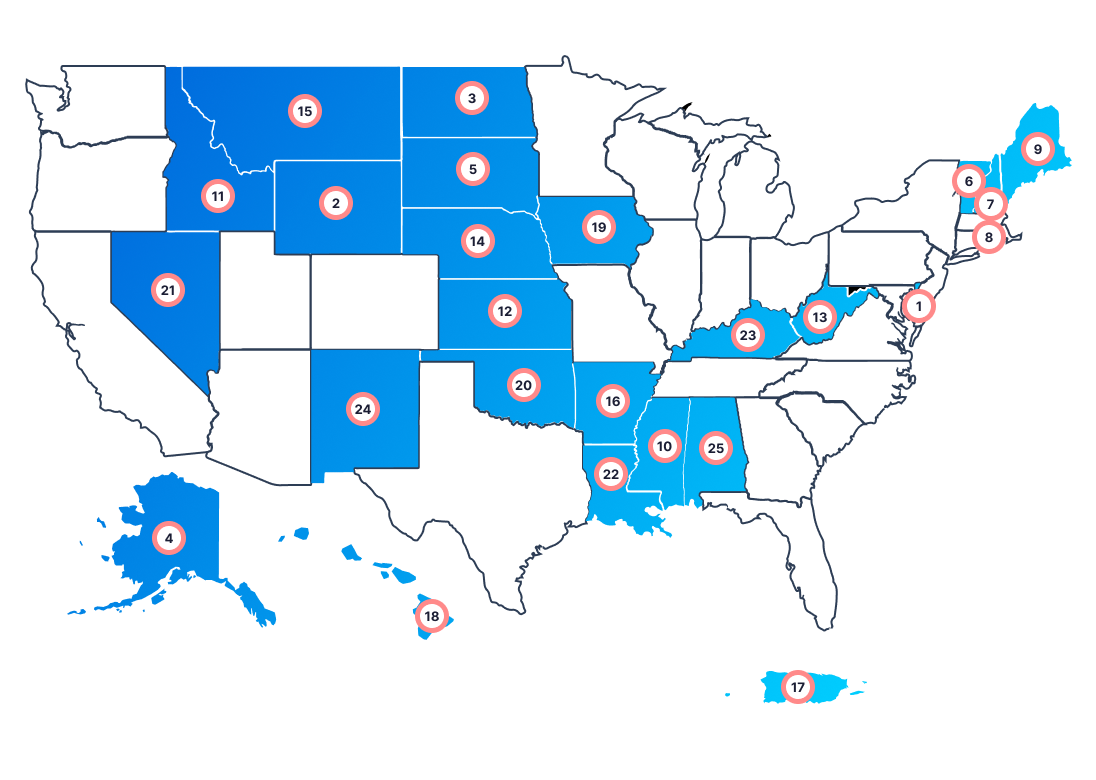
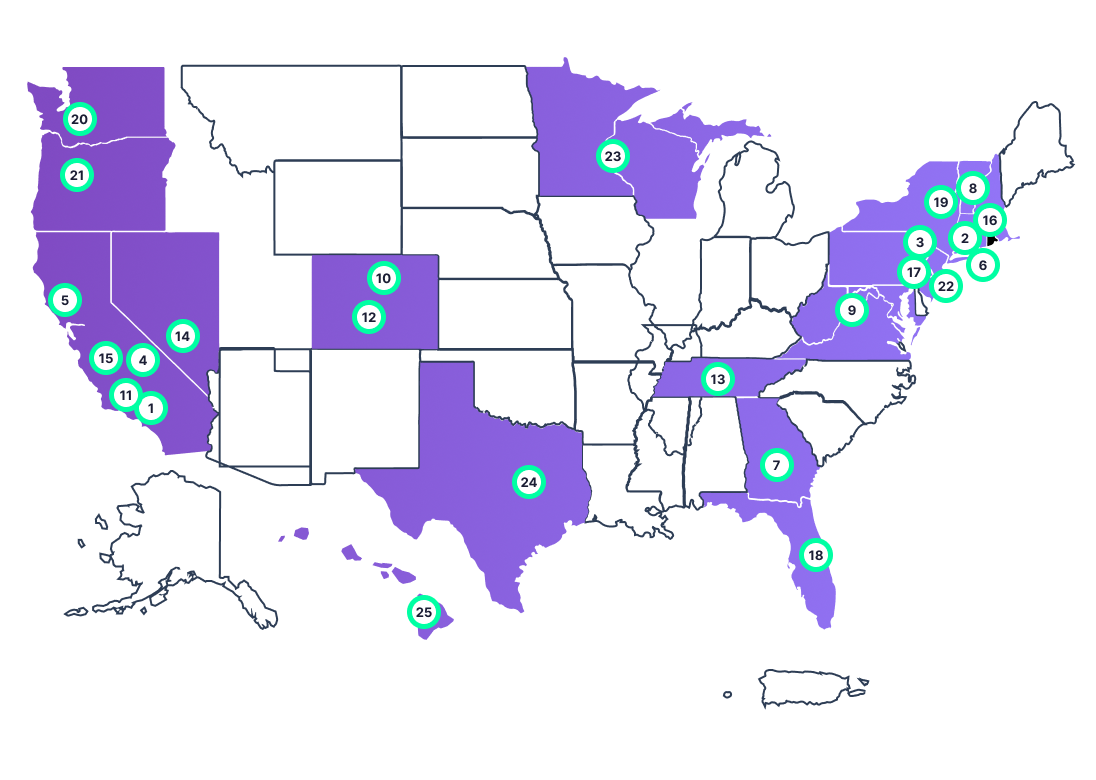
Top 25
WORST states for
Producers
and Directors
Watching content of all forms is certainly on the rise, but there are some states where producing and directing are not as prevalent. From the number of available jobs to the wages a producer or director can expect, these are the worst states for people in the industry.
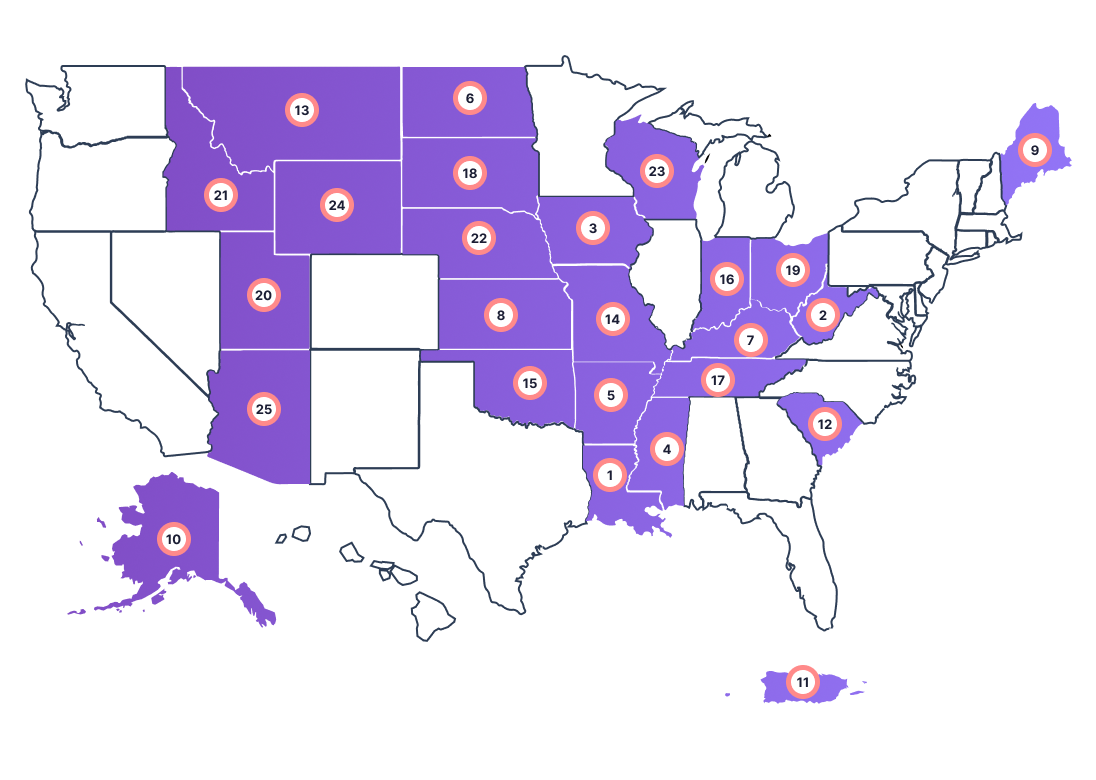
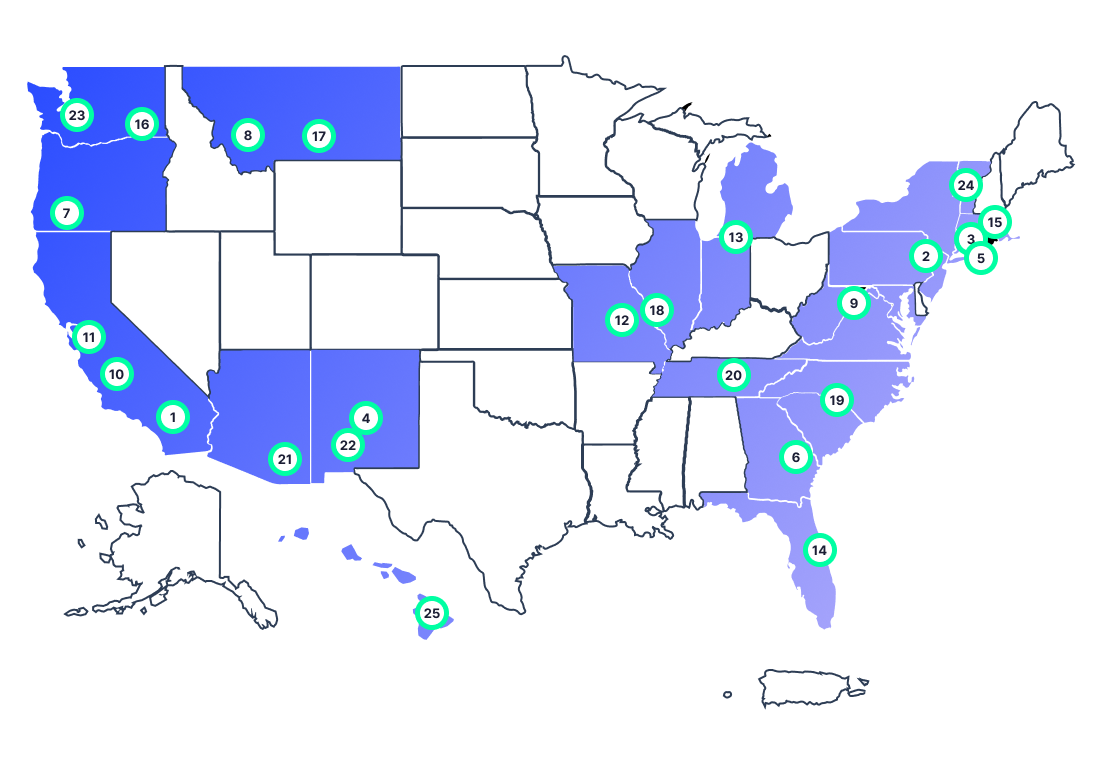
Top 25
BEST Metro Areas for
Producers
and Directors
Between the concentration of viewers in a metropolis and the prevalence of the arts that tends to exist in those areas, producers and directors can generally expect a bigger audience in some cities, including the following.
With a populace that loves to view shows, movies, and TV, producers and directors certainly have their work cut out for them when it comes to creating new content. But luckily, these talented individuals are up to the task and ready to work!
While the work can be hard, as producers and directors deal with a lot of pressure and many deadlines in their jobs, with hours that often extend past a normal working day, the end product is enjoyed by thousands of excited viewers. So hopefully, that makes the entire process worthwhile!
- How has the demand for producers and directors changed in recent years?
- How many producer and director jobs are available across the country?
- What is the median salary for a director/producer?
- What kinds of companis hire directors and producers?
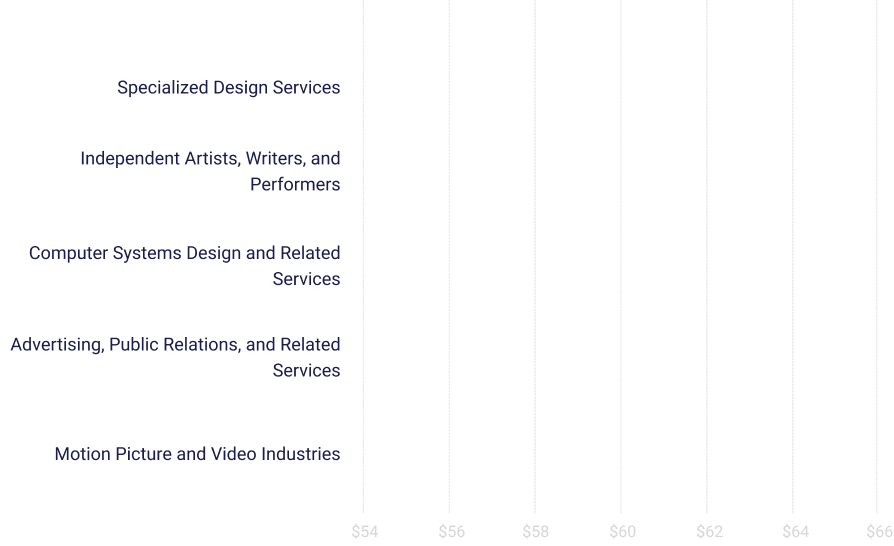
- What sector of the film industry pays the highest hourly wage?
- What states have the highest number of director and producer jobs available?
- Which states pay directors and producers the most?
- What states have the highest concentration of producer and director jobs?
- What are the worst states for director and producer jobs?
- What states have the lowest concentration of director and producer jobs?
- What are the best metro areas for producers and directors?
- How much are director/producer job prospects projected to increase in the next 10 years?
- Leather Movie Recliner
- Home Furniture Couches
- Modern Comfortable Recliners
- Best Sectional Recliners
- Movie Theater Chairs For Sale
- Double Recliner Loveseat
- Sectional Recliner Couch For Sale
- 4 Pcs Sectional
- Home Media Chair
- Cost Of A Recliner Chair
- Upholstered Movie Recliners
- Media Room Sectional Couch
- 4 Seat Couch With Recliners
- Black Leather Theater Recliner
- Home Theater Store Online
- Top Rated Home Theater Seating
- Leather Seat Single Seat
- Top Grain Leather Sectional Sale
- Movie Theater Seats On Sale
- Best High End Recliners
- Media Room Sectional Sofas
- Recliner With Adjustable Lumbar
- White Sofa Chairs
- Pillows For Recliner Chairs
- Console Couch
- Red Sectionals Furniture
- Top Rated Theater Seat Brand
- Massage Movie Chairs
- Chair Risers For Recliners
- Front Row Theater Seats
- Riser For Home Theater Seating
- Couch With Usb Plugs
- My Octane Home Theater Seating
- Curved Seat Home Theater
- Wall Hugging Recliner Loveseat
- Comfortable Supportive Chair
- Movie Theater Seats Table
- Manufacturer Of Theater Seating
- Octane Seating Recliners
- 2 Seater Recliner With Centre Console
- Leather Reclining Couches With Massage
- Chaise Lounge Theater Seating
- Movie Recliners Small Room
- Stadium Seating For Media Room
- Reclining Sectional With Chaise
- Best States For Interior Design
- Couch Cloth Material
- Men Recliners
- Big And Tall Furniture Online
- Dark Leather Sofas
- Home Theater Seat Dimensions
- Leather Power Recline Sectional
- Receiver For Surround Sound
- Leather Reclining Sofa Sectional
- Microfiber Theater Seat
- Wide Reclining Sofa
- Leather Reclining Chairs With Cup Holders
- Build A Theater Seat Riser Platform
- Best Home Theatre Dimensions
- Home Theater Seating Distance Calculator
- Dream Man Cave
- Acoustic Drywall