
Best and Worst states and cities in the U.S. for Actors

By March 8, 2022May 12th, 2023Actors, Film & TV, Jobs

Actors are a special group of talented individuals, due to their abilities to dazzle audiences on stage and on the screen. As you might expect, California and New York continue to be the best states for media, movies, and the people who work in that industry— which, given the glitz and glam of those locations, should not come as a great surprise! Chicago, Illinois, and Atlanta, Georgia, are also on the list.

But when it comes to places that aspiring and established actors might not want to set up shop in, there are several states that are likely not ideal for furthering their careers, including Michigan, South Dakota, and Massachusetts.

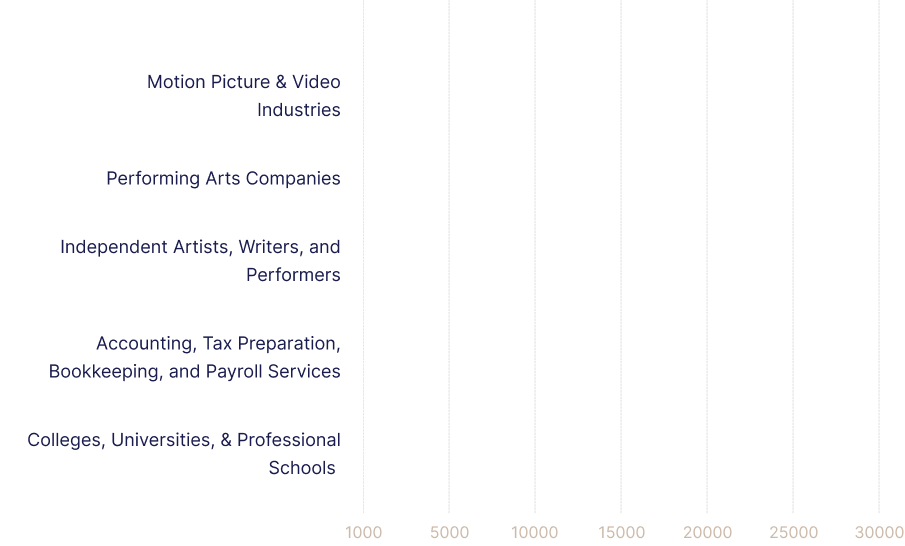
Yet for many in the movie industry, the United States is still a great place to get your start on the silver screen and. In fact, the motion picture and movie industries are among the highest in the U.S., with over 27.8 thousand as the national employment average.

After all, Americans are known for their love of movies, and the entire industry has much of its history set in the United States. From the first “film” shown via Thomas Edison’s kinetoscope in New York City in 1894, to the Golden Age of Hollywood that saw stars like Lionel Barrymore and Ingred Bergman shining on screen, the U.S. has fostered film and television to a further degree than nearly any other location.

$20.43

Median Pay,
2019

70,100

Number of Jobs,
2019

3%

Job Outlook,
2019-29

2,100

Employment Change,
2019-29

This study was conducted by the TheaterSeatStore team.

National estimates for this occupation

27,840

80%

9,650

28%

3,000

13%

2,860

11%

2,800

8%
employment graph
Motion Picture & Video Industries

27,840

80%
Performing Arts Companies

9,650

28%
Independent Artists, Writers, and Performers

3,000

13%
Accounting, Tax Preparation, Bookkeeping, and Payroll Services

2,860

11%
Colleges, Universities, & Professional Schools

2,800

8%

$47.07

86%

$37.34

45%

$35.94

36%

$35.41

34%

$31.34

18%
hourly graph
Performing Arts Companies

$47.07

86%
Motion Picture and Video Industries

$37.34

45%
Independent Artists, Writers, and Performers

$35.94

36%
Museums, Historical Sites, and Similar Institutions

$35.41

34%
Sound Recording Industries

$31.34

18%

top
best states for actors

Here are the top 15 U.S. regions with the highest number of job, daily wages, and job concentration per 1000 people.

Best acting jobs by state U.S. Map
No.
state
Number of Employment
01
California
19470
02
New York
7440
03
Illinois
3950
04
Georgia
3000
05
Louisiana
2240
06
Pennsylvania
2050
07
Maryland
1220
08
Texas
1120
09
Colorado
650
10
Indiana
630
11
Washington
570
12
Massachusetts
550
13
Virginia
550
14
Florida
540
15
Missouri
540
16
Ohio
530
best acting jobs by hourly wage U.S. map
No.
state
Number of Employment
01
North Carolina
33.81
02
South Carolina
32.32
03
Colorado
29.92
04
California
29.60
05
Nevada
29.21
06
Georgia
27.81
07
Arizona
26.11
08
Illinois
25.20
09
Maryland
25.16
10
Mississippi
23.44
11
Michigan
22.46
12
Washington
21.70
13
Rhode Island
21.50
14
Hawaii
20.89
Best acting jobs by concentration U.S. Map
No.
state
Number of Employment
01
Louisiana
1.163
02
California
1.120
03
New York
0.782
04
Georgia
0.670
05
Illinois
0.655
06
District of Columbia
0.598
07
New Mexico
0.515
08
Maryland
0.450
09
Pennsylvania
0.347
10
Colorado
0.244
11
Connecticut
0.218
12
Indiana
0.205
13
Missouri
0.193
14
Washington
0.172
15
Massachusetts
0.151
16
Minnesota
0.145
17
Virginia
0.143

top
WORST states for actors

Here are the worst 15 U.S. regions with the highest number of job, daily wages, and job concentration per 1000 people.

worst states to get acting jobs
No.
state
Number of Employment
01
Rhode Island
30
02
Vermont
40
03
South Dakota
40
04
Oklahoma
50
05
Nebraska
50
06
Mississippi
50
07
North Carolina
150
08
South Carolina
210
09
Tennessee
240
10
Oregon
260
11
Michigan
270
12
Connecticut
360
13
Wisconsin
370
14
Arizona
370
15
New Mexico
420
16
Minnesota
420
states with the worst wages for actors by the hour
No.
state
Number of Employment
01
Louisiana
13.79
02
Wisconsin
14.54
03
Indiana
14.60
04
Oklahoma
15.03
05
Nebraska
15.51
06
South Dakota
16.49
07
Ohio
17.52
08
Minnesota
17.79
09
Missouri
18.73
10
Florida
18.89
11
Pennsylvania
18.91
12
Massachusetts
19.35
13
Tennessee
19.50
14
Texas
20.29
states with the worst concentration of jobs
No.
state
Number of Employment
01
Oklahoma
0.033
02
North Carolina
0.033
03
Mississippi
0.040
04
Nebraska
0.056
05
Michigan
0.062
06
Florida
0.062
07
Rhode Island
0.064
08
Tennessee
0.081
09
South Dakota
0.088
10
Texas
0.090
11
Ohio
0.097
12
South Carolina
0.100
13
Wisconsin
0.128
14
Vermont
0.129
15
Arizona
0.129
16
Oregon
0.138

top 25
Metro Areas for actors

Here are the top 25 metro cities in the U.S with the highest number of job, daily wages, and job concentration per 1000 people.

number of acting jobs US map
No.
state
Number of Employment
01
Los Angeles-Long Beach-Anaheim, CA
17460
02
New York-Newark-Jersey City, NY-NJ-PA
7000
03
Chicago-Naperville-Elgin, IL-IN-WI
3140
04
Atlanta-Sandy Springs-Roswell, GA
1620
05
Baltimore-Columbia-Towson, MD
980
06
Philadelphia-Camden-Wilmington, PA-NJ-DE-MD
960
07
Washington-Arlington-Alexandria, DC-VA-MD-WV
890
08
San Francisco-Oakland-Hayward, CA
720
09
Indianapolis-Carmel-Anderson, IN
540
10
Denver-Aurora-Lakewood, CO
500
11
Seattle-Tacoma-Bellevue, WA
500
12
Pittsburgh, PA
410
13
Albany-Schenectady-Troy, NY
350
14
Minneapolis-St. Paul-Bloomington, MN-WI
350
15
Boston-Cambridge-Nashua, MA-NH
320
16
Houston-The Woodlands-Sugar Land, TX
260
17
Salt Lake City, UT
240
18
Orlando-Kissimmee-Sanford, FL
210
19
Southwest Missouri nonmetropolitan area
170
20
Medford, OR
150
21
Miami-Fort Lauderdale-West Palm Beach, FL
140
22
Cincinnati, OH-KY-IN
120
23
Lancaster, PA
120
24
Bridgeport-Stamford-Norwalk, CT
110
25
Portland-Vancouver-Hillsboro, OR-WA
110
Average actor wage by hour U.S. Map
No.
state
Number of Employment
01
New York-Newark-Jersey City, NY-NJ-PA
43.29
02
New Haven, CT
33.38
03
Denver-Aurora-Lakewood, CO
33.10
04
Los Angeles-Long Beach-Anaheim, CA
29.57
05
San Francisco-Oakland-Hayward, CA
29.45
06
Las Vegas-Henderson-Paradise, NV
28.06
07
Albany-Schenectady-Troy, NY
28.43
08
Phoenix-Mesa-Scottsdale, AZ
28.30
09
Richmond, VA
28.10
10
Chicago-Naperville-Elgin, IL-IN-WI
25.56
11
Seattle-Tacoma-Bellevue, WA
22.55
12
Providence-Warwick, RI-MA
21.17
13
Houston-The Woodlands-Sugar Land, TX
21.12
14
Urban Honolulu, HI
21.07
15
Philadelphia-Camden-Wilmington, PA-NJ-DE-MD
20.44
16
Baltimore-Columbia-Towson, MD
20.28
17
Southwest Missouri nonmetropolitan area
20.13
18
San Jose-Sunnyvale-Santa Clara, CA
19.69
19
Boston-Cambridge-Nashua, MA-NH
18.89
20
Hartford-West Hartford-East Hartford, CT
18.72
21
Miami-Fort Lauderdale-West Palm Beach, FL
18.42
22
Lancaster, PA
18.36
23
Madison, WI
18.00
24
Salt Lake City, UT
17.84
25
Myrtle Beach-Conway-North Myrtle Beach, SC-NC
17.05
Acting jobs by metro area U.S. Map
No.
state
Number of Employment
01
Los Angeles-Long Beach-Anaheim CA
2.799
02
Southwest Missouri nonmetropolitan area
2.306
03
Medford, OR
1.789
04
Albany-Schenectady-Troy, NY
0.780
05
East Tennessee nonmetropolitan area
0.729
06
New York-Newark-Jersey City, NY-NJ-PA
0.725
07
Baltimore-Columbia-Towson, MD
0.710
08
Chicago-Naperville-Elgin, IL-IN-WI
0.672
09
Atlanta-Sandy Springs-Roswell, GA
0.589
10
Myrtle Beach-Conway-North Myrtle Beach, SC-NC
0.547
11
Indianapolis-Carmel-Anderson, IN
0.514
12
Lancaster, PA
0.472
13
Savannah, GA
0.427
14
Pittsburgh, PA
0.354
15
Philadelphia-Camden-Wilmington, PA-NJ-DE-MD
0.333
16
Salt Lake City, UT
0.333
17
Denver-Aurora-Lakewood, CO
0.330
18
Asheville, NC
0.290
19
San Francisco-Oakland-Hayward, CA
0.289
20
Washington-Arlington-Alexandria, DC-VA-MD-WV
0.281
21
Bridgeport-Stamford-Norwalk, CT
0.264
22
Seattle-Tacoma-Bellevue, WA
0.248
23
Central East New York nonmetropolitan area
0.247
24
Allentown-Bethlehem-Easton, PA-NJ
0.221
25
Oxnard-Thousand Oaks-Ventura, CA
0.207

It should come as no surprise that a job in the movie industry is one of the original “American dreams” that many aspiring actors have. But what is the outlook for the best and worst areas across the U.S. for actors today? The answer may surprise you, but if you read on, you will find all the numbers and statistics that reveal exactly what actors might expect in the United States.